
he biggest stories concerned the Stage 4 Lockdown in Melbourne and how this would affect our property markets and the economy.
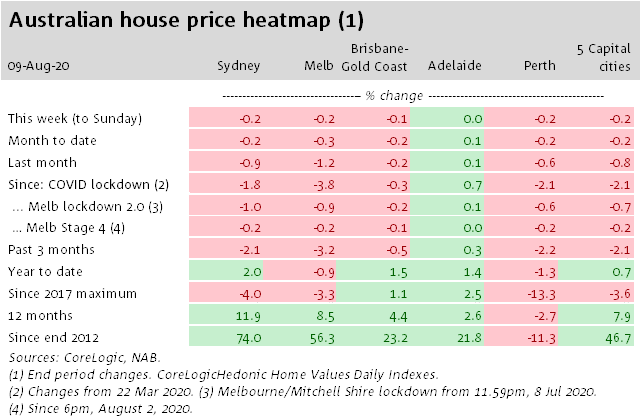
The underlying trend in prices have continued to soften in the wake of the pandemic, across the major capital cities barring Adelaide where prices have been more resilient.
Since Australia’s international borders were closed on 22 March;
- Sydney prices have eased 1.8%,
- Melbourne have softened by 3.8%,
- Perth property values eased by 2.1%,
- Brisbane home values are broadly steady (-0.3%),
- Adelaide prices have risen 0.7%.
The Melbourne property market will now go into hibernation as Victorian Premier Andrews announced a State of Disaster for Victoria to be in force for six weeks through September 13.
To help keep you up-to-date with all that’s happening in property, here is my updated weekly analysis of data and charts provided by Corelogic and realestate.com.au.
Then further down in this long article you’ll find a more detailed State by State update using Corelogic’s monthly July 2020 charts.
Early Market Indicators
Let’s start with the number of indicators that could give us a clue to what’s ahead.
- Buyer activity edged higher last week as shown by realestate.com.au’s Weekly Demand Report
Nationally buyer search activity realestate.com.au fell by -3.4 per cent, which was the largest weekly decline in 19 weeks.
However, a closer look at the data shows the national figure has been significantly pulled down by a large fall in Victoria (-13.3%).
Most other states recorded more modest falls; New South Wales (-1.5%), South Australia (-1.3%), Western Australia (-0.1%) and Tasmania (-1.7%).

Nationally, buyer search volumes have now declined by -4.9 per cent from their peak.
In Victoria search volumes are -18.6 per cent below their peak.
Despite the recent decline in search volumes nationally, it’s important to note volumes are still 28.8 per cent higher than they were a year ago.
Even in Victoria, search volumes remain 9.4 per cent higher than last year.
And while lockdowns are likely to impact on search behaviour for a few weeks (based on the data from the first lockdown period) REA expect that search behaviour will start to rebound as cases come under control and individuals start to see an end to the lockdown period.
The largest year-on-year increases in for sale search volumes have been recorded in Australian Capital Territory (98.5%) and Northern Territory (40.6%).
Melbourne’s second round of COVID-19 restrictions are having more of an impact on the property market than the first, with search activity dropping significantly in Victoria last week.
The -13.3 per cent fall in for sale search volumes in Victoria as the state went back into lockdown marked the largest weekly decline this year.
This highlights that, at least initially, the re-implementation of lockdowns in Victoria is having a bigger impact on search behaviour than the first round did.

2. Newly advertised properties for sale and rent
The following chart from Corelogic shows the change in the number of new residential listings being advertised for sale or rent in the past 7 days.
Over the last week the number of new properties coming on the market for sale dropped by close to 3% – not surprising considering the concern about Coronavirus and the number of new properties advertised for sale virtually steady over the month also.
At the same time there have been 5% fewer new properties advertised for lease, reversing the prevailing trend over the last few months.

3. Rental markets.
Realestate.com.au tracks the number of rental searches on its portal and reports that after rental demand steadied last week after falling for five weeks consecutive weeks.
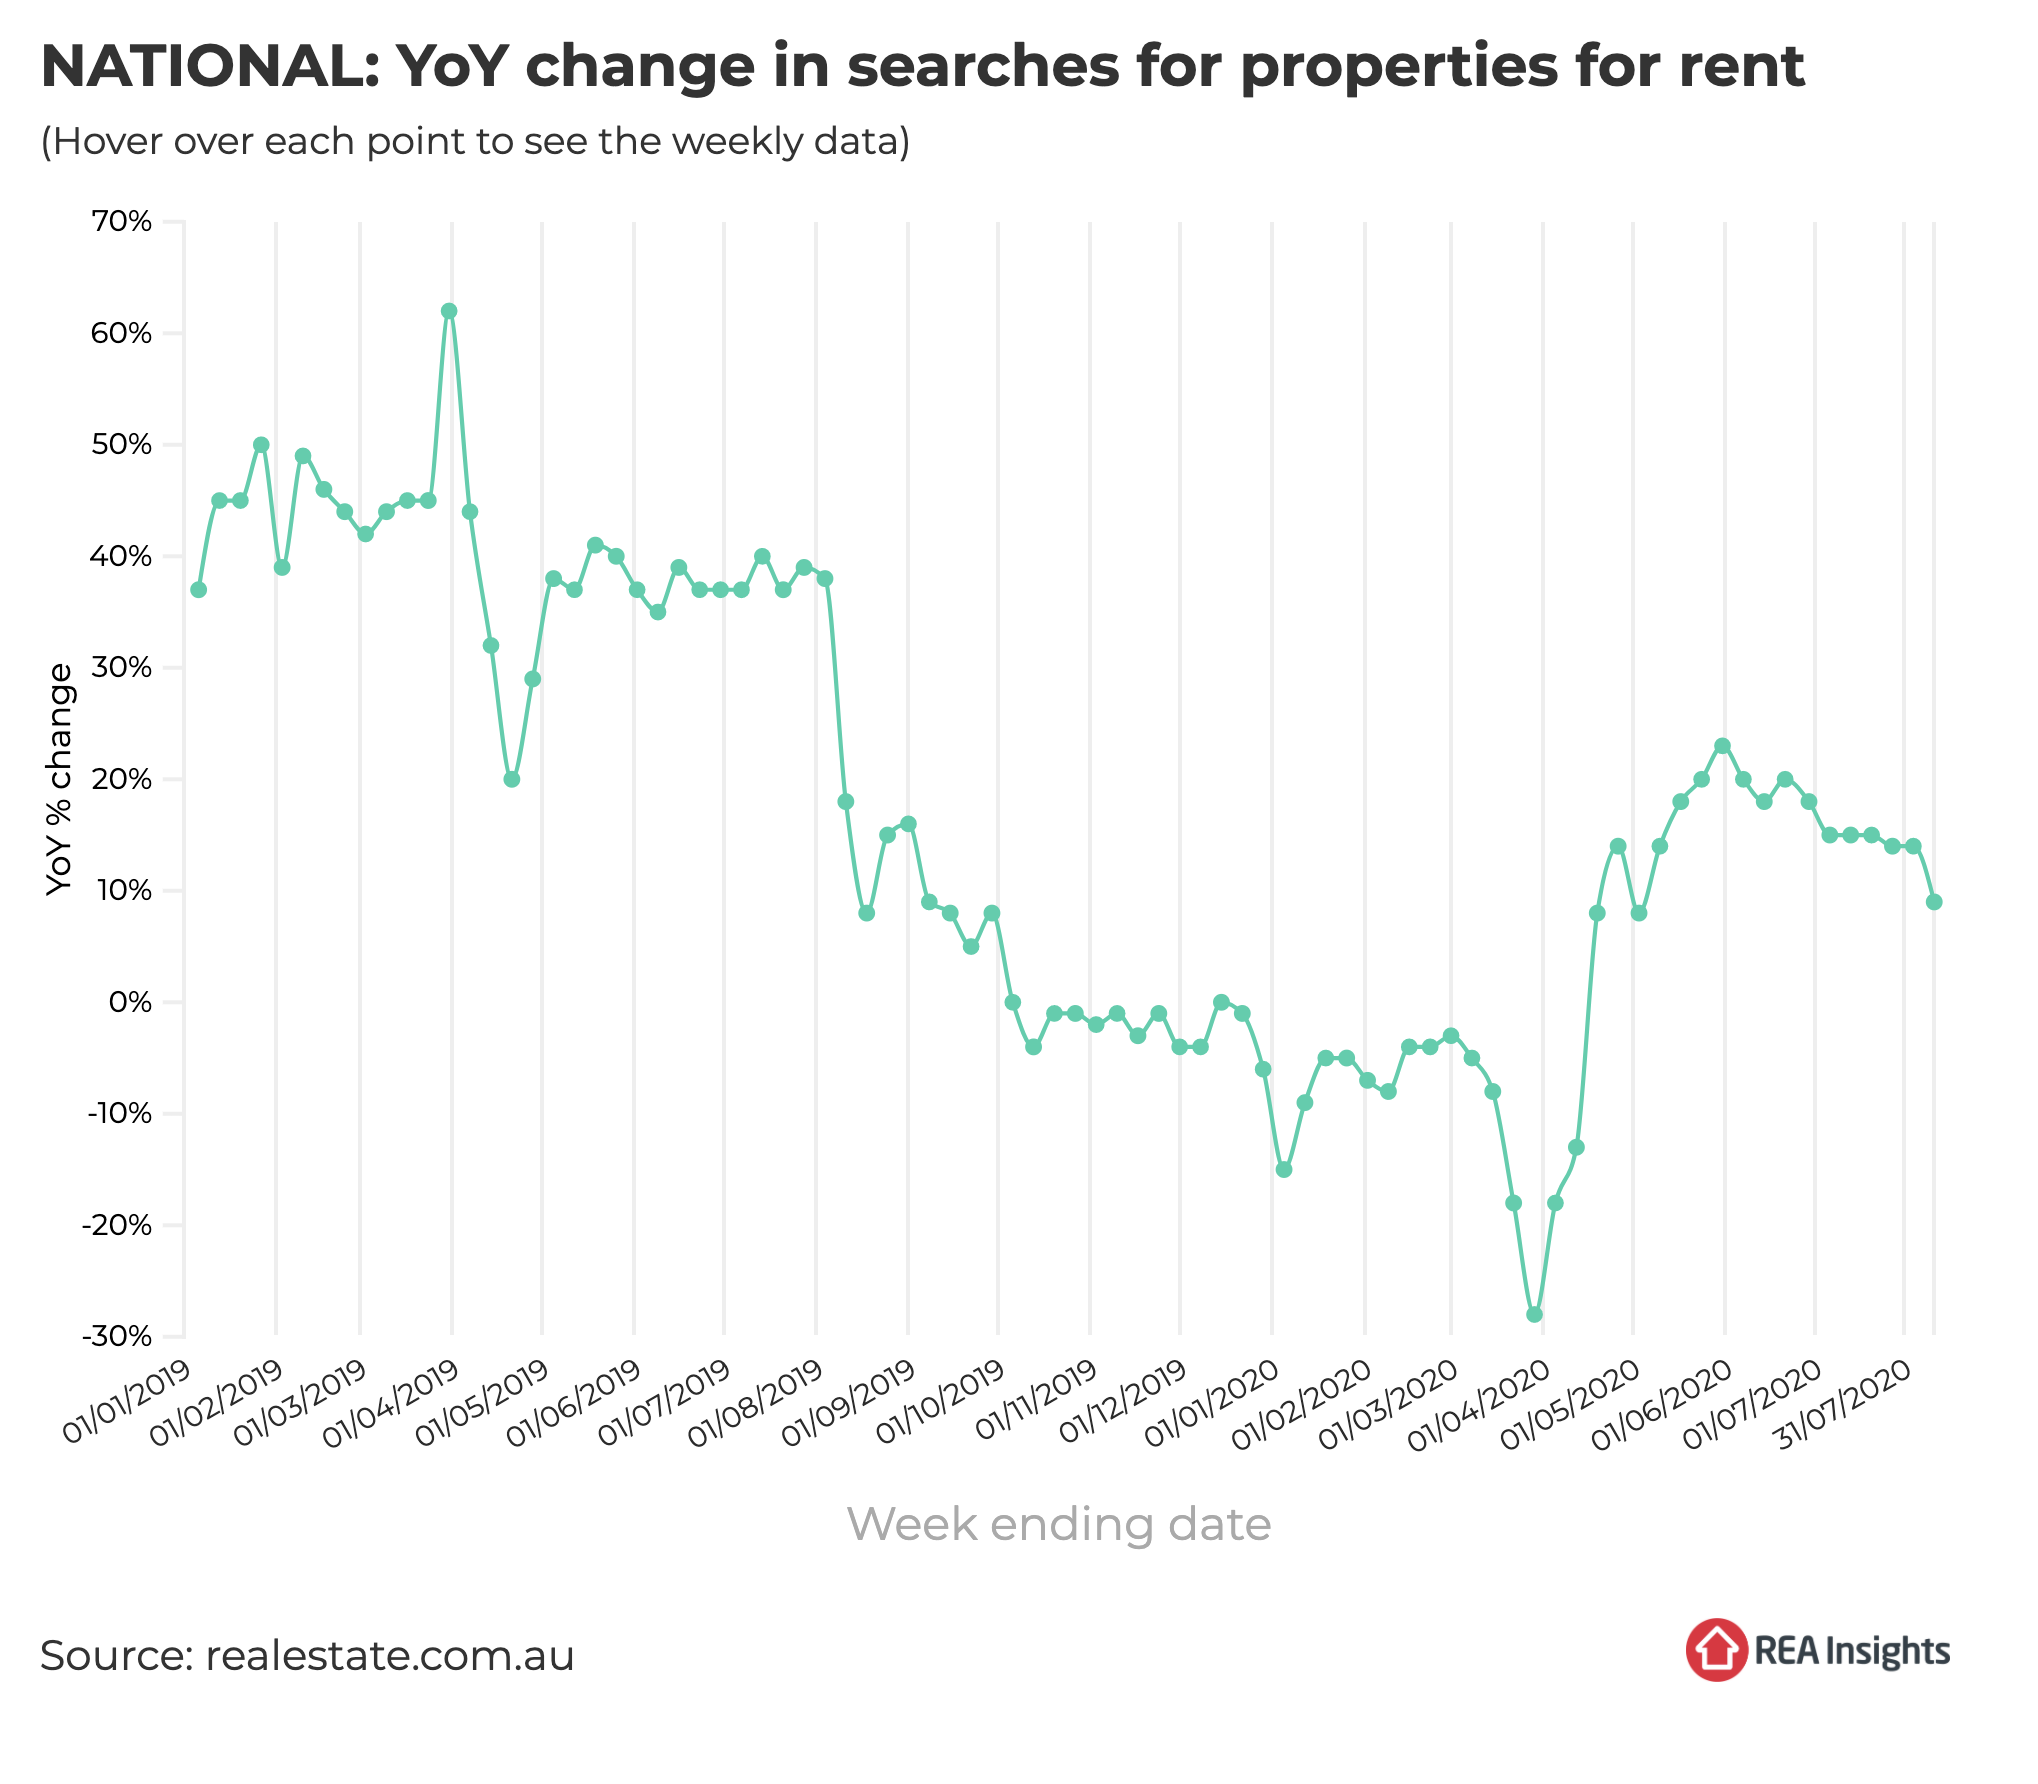
Search data from realestate.com.au shows that the rental market is following a similar trend.
Last week national rental search volumes fell -2.8 per cent led by a -16.9 per cent drop in Victoria – the largest drop experienced in 2020.
Falls were also recorded in Tasmania (-0.5%) and Northern Territory (-2.0%), while increases were recorded in Queensland (3.7%) and Western Australia (1.7%).
The largest decline in rental search volumes from the peak has been recorded in Victoria (-25.8%) followed by Northern Territory (-20.4%), while the smallest falls have been recorded in Australian Capital Territory (-2.6%) and New South Wales (-3.9%).
Although there have been recent declines in weekly national rental search volumes, last week they were still 8.9 per cent higher than at the same time last year.
Rental search volumes are now lower than they were a year ago in Victoria (-7.6%) and marginally higher in South Australia (7.2%) while Australian Capital Territory (69.4%) and New South Wales (24.6%) have recorded the largest increases.
Lockdowns are having an impact on consumer confidence nationwide and that is likely to contribute to softer search volumes nationally until such time as COVID-19 cases come back under control in Victoria and assuming they remain under control elsewhere.
4. Finance Activity
While many Australians have been busy getting new loans, as you can see from the charts below, more than two thirds of these were for refinancing existing loans, rather than for new property purchases.
Of course this isn’t surprising considering the prevailing low interest rates.

What’s happening to property prices?

Considering all the negative market sentiment, capital city property values have held up pretty well over the last month.
While property values are slipping a little, one has to dig deeper into the numbers to see the full picture.
Certain segments of our markets are holding their values well, with a shortage of A grade homes and investment properties compared to the number of buyers out looking for them meaning that property values in certain locations are creeping up.
On the other hand B grade (secondary) properties are selling at a discount and no one really wants C grade properties.
There is a flight to quality.
Significant policy support and the earlier reopening of the economy have meant the various “worst-case scenarios of 20-30% price falls” that some of the economists have been touting now seem highly unlikely.
However, I still see property values falling a little further as unemployment will remain high, consumer confidence will continue to languish and immigration will fall.


Properties listed for sale

‘New’ listings means the count is of listing events that have so far not been seen in the current calendar year.
This measure provides insight regarding the volume of new properties coming on to the market. An increase in new listings suggests an increasing supply of stock available, and higher seller or lessor activity.
And a positive sign is that vendors seem to be gaining a little confidence, as more are starting to bring their homes onto the market for sale.
The following table shows the total number of properties for sale around our capital cities.
Even though sellers are returning to the market, overall the number of properties listed for sale is down 12.3% over the year.

As you can see from the following chart, despite more properties coming onto the market for sale, the total number of listings (properties available for sale) is falling, and Corelogic report that there are 1.3 buyers in the market for every property for sale.
This confirms what we are finding on the ground Metropole that well located properties are selling quickly with a queue of buyers waiting for them

The number of property transactions
The Coronavirus lockdowns have caused a very significant slow down in transaction numbers.
The following table of private treaty sales (which represents the vast majority of all dwelling sales across the country) shows that over the last week:
- In Melbourne 1,533 houses (last week 1,528) and 688 apartments or units were sold (last week 685) – so over the last few weeks the number of transactions keeps increasing.
- In Sydney 1,270 houses (1,3oo last week) and 683 apartments were sold (752 last week), so the market is continuing its steady growth.
- In Brisbane only 813 houses (751 last week) and 195 apartments were sold (226 last week) -so the market has remained steady, but is considerably more active than a month ago.


NOW READ: Victoria Stage 4 Lockdown – what does it mean for the Melbourne property market?
Vendor Metrics
Vendor metrics had generally remained steady with the number of days to sell a property decreasing (a sign of the tight supply situation), and vendor discounting (it’s easier for them to sell) at realistic levels.
The shortage of good properties on the market in Sydney, Brisbane and Melbourne is seeing properties selling quickly with minimal discounting.
But now that discretionary sellers are out of the market and the number of new properties listed for sale has falling significantly, we’ll watch these metrics carefully as they are a good indication of supply and demand.
It is likely that these metrics will start to show that it takes longer for a property to sell and the vendors will be required to offer a higher discount to affect a sale, especially for secondary properties.


Auction clearance rates
There were 1,160 homes taken to auction across the combined capital cities this week, similar to the previous week when 1,154 auctions were held, and slightly higher than this time last year (1,111).
The combined capital city preliminary auction clearance rate was recorded at 65.9 per cent across 882 auction results so far this week, slightly higher than last week’s preliminary result of 65.3 per cent, which later revised down to 58.7 per cent.
This time last year saw a final clearance rate of 67.8 per cent.

In Melbourne, 298 homes were scheduled for auction this week, down from 357 over the previous week and 500 this time last year.
The number of auctions held across Melbourne has reduced sharply through the lockdown period, but withdrawal rates have been much lower relative to the previous lockdown period in April and early May earlier this year.
The preliminary collection indicates only 18% of Melbourne auctions were withdrawn from the market this week, compared with a peak of 65% through the second week of April.
Of the 244 auction results collected so far, 73.0 per cent were successful, although this will likely revise lower as the remaining auction results are collected.
Last week saw a final clearance rate of 55.1 per cent recorded across the city, while this time last year, 72.3 per cent of Melbourne auctions were successful.
Sydney was host to 642 auctions this week, up from 566 over the previous week and 367 this time last year. Of the 483 auction results collected so far, 65.8 per cent have returned a successful result.
Last week, a final clearance rate of 60.7 per cent was recorded, while one year ago, a success rate of 76.2 per cent was achieved across Sydney.

Of course the above auction clearance rates were on a relatively very small number of auctions:-


Here is a regional breakdown of auction results:-


Still downward pressure on Sydney & Melbourne rents
Asking rents in Sydney and Melbourne have continued to soften, even though there’s been no further apparent increase in the vacancy rates.
It’s different in the other capital cities.
- Rather than rising, Perth’s rental vacancy rate has continued to decline and now is down to 1.5%.
- Hobart’s rental market also seems to have strengthened with a tight vacancy rate of just under 1.0%.
- Adelaide asking rents have been relatively steady, also with a low 1.0% vacancy rate.
- Brisbane’s market has been more volatile, perhaps stabilising in recent weeks after an earlier period of weakness.


The Statistics above are updated weekly.
The following State by State Data is updated Monthly at the beginning of each month
My commentary below is based on Corelogic’s charts provided at the beginning of June 2020.

Sydney Property Market

Prior to COVID-19 the Sydney property market was on the move having recorded its quickest turnaround in decades.
But Sydney home values slid for a second month in June, down a cumulative 1.2% since a recent peak in April.
The largest falls are occurring across the top quartile of the market where home values have dropped by 1.3% over the June quarter, while the least expensive quarter of the market has actually recorded a subtle rise up two-tenths of a percent over the same period.
Sydney property values are -3.5% below their highs reached in July 2017.
- Sydney house values decreased by -1.0% last month (+13.2% over the last year)
- Sydney unit values decreased by -0.7% last month (+9.5% over the last year.)
While home values are trending lower, rents have also declined, falling by 0.8% over the month to be 1% lower over the year.
The weakest rental conditions are confined to the unit market where rates are down 2.1% over the June quarter.

From a more positive perspective, our estimate of sales activity is up by around 40% from the April low and auction clearance rates have averaged 61% through June.
This implies an improvement in buyer demand and a better fit between buyer and seller pricing expectations.
While A grade homes and investment grade properties are likely to fall a little (- 5- 10%) moving forward, this is a great time for cashed-up investors and homebuyers planning to upgrade to buy a property considerably cheaper than they would have had to pay a few months ago, and for considerably less than they will have to pay this time next year.
B grade (secondary) dwellings may fall in value by 10-15% and C grade properties are likely not to sell at all.
Sure there are fewer good properties for sale at the moment, and almost all the good ones are for sale off market, however if you’d like to know a bit more about how to find these investment gems give the Metropole Sydneyteam a call on 1300 METROPOLE or click here and leave your details.

Melbourne Property Market
Before Coronavirus hit our markets, Melbourne property prices were surging with dwelling values up 12% higher to reach new highs.
However, Melbourne housing values recorded a third consecutive month of declines in June resulting in 2.3% drop in values over the quarter.
Melbourne’s top quartile properties are recording the largest declines, down 3.7% over the second quarter.
Lower quartile values fell by only half a percent.
Previous phases of the housing market have shown a very similar trend with the most expensive segment of the marketplace leading the growth phase as well as the downswings.
Melbourne rents were down six-tenths of a percent in June.
The unit sector recording more substantial downwards pressure on rents than houses.
Despite lower values housing demand has gathered some pace across Melbourne after sales dropped by a third in April, our estimate of sales in June was up almost 60% on that April low.
- Melbourne house values dropped -1.4% last month (+8.9% over the last year.)
- Melbourne unit values decreased -0.7 last month (+8.2% over the last year.)
The monthly fall comes after a strong rebound in housing values since June last year which saw Melbourne dwelling values reach a new record high in February.
Like in Sydney, A grade homes and investment grade properties in Melbourne are likely to fall a little (5- 10%) moving forward.
B grade (secondary) dwellings may fall in value by 10-15% and C grade properties are likely not to sell at all.
At Metropole we’re finding that strategic investors with a long-term view and homebuyers looking to upgrade are still in the market, picking the eyes out of the off market properties.
It’s likely that they see the long-term fundamentals, as Melbourne rates are one of the 10 fastest-growing large cities in the developed world,.
Melbourne’s population was forecast to increase by around 10% in the next 4 years.
Clearly this will slow down now, with restricted borders protecting Australia, but once we “cross the bridge” Melbourne will remain one of the most liveable cities in the world.
If you’d like to know a bit more about how to find investment grade properties in Melbourne please give the Metropole Melbourne team a call on 1300 METROPOLE or click here and leave your details.
